Graphs
Here's an example of a graph easily extracted from the
eBATS measurements:
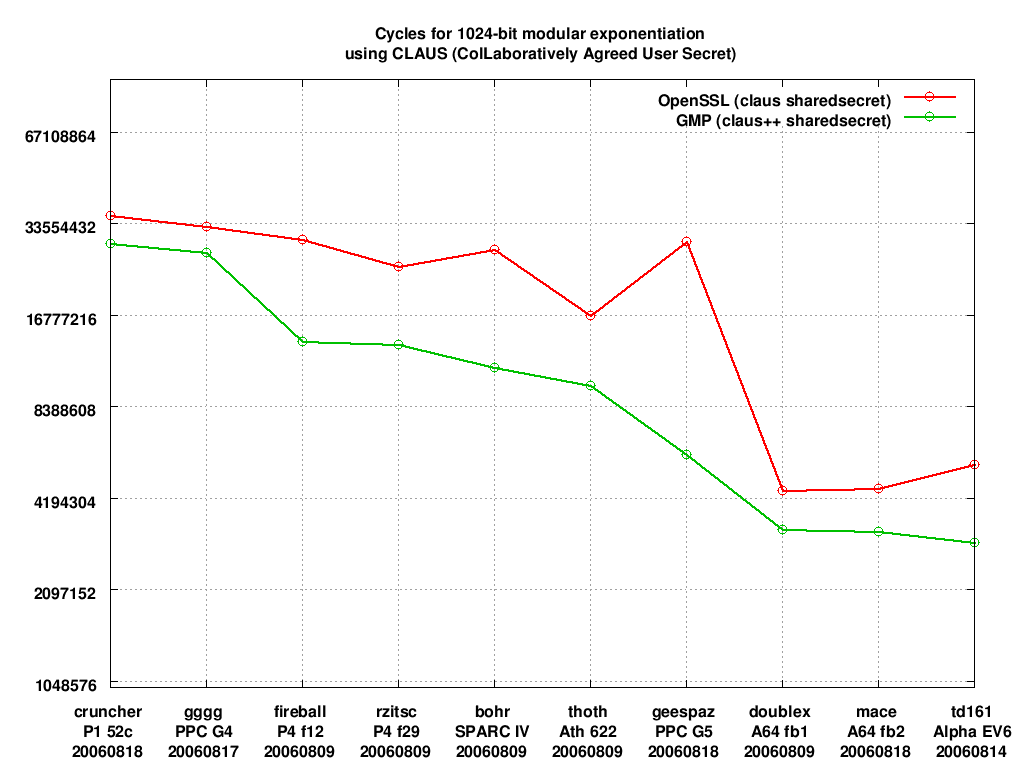
This graph was produced by the
20060928-claus-machines.do
script.
For more examples of BAT measurement graphs,
see Section 4 of the D.VAM.7 report,
and try using the CAVE program.
Version
This is version 2006.09.28 of the eBATS graphs.html web page.
This web page is in the public domain.